Two COVID-19 pandemic curves emerged within many cities during the one-year period from March 2020 to March 2021. Oddly, the number of total daily infections reported during the first wave is much lower than that of the second, but the total number of daily deaths reported during the first wave is much higher than the second wave.
Tag: Second Wave
COVID-19: Second Wave for Some; Others Remain in First Wave
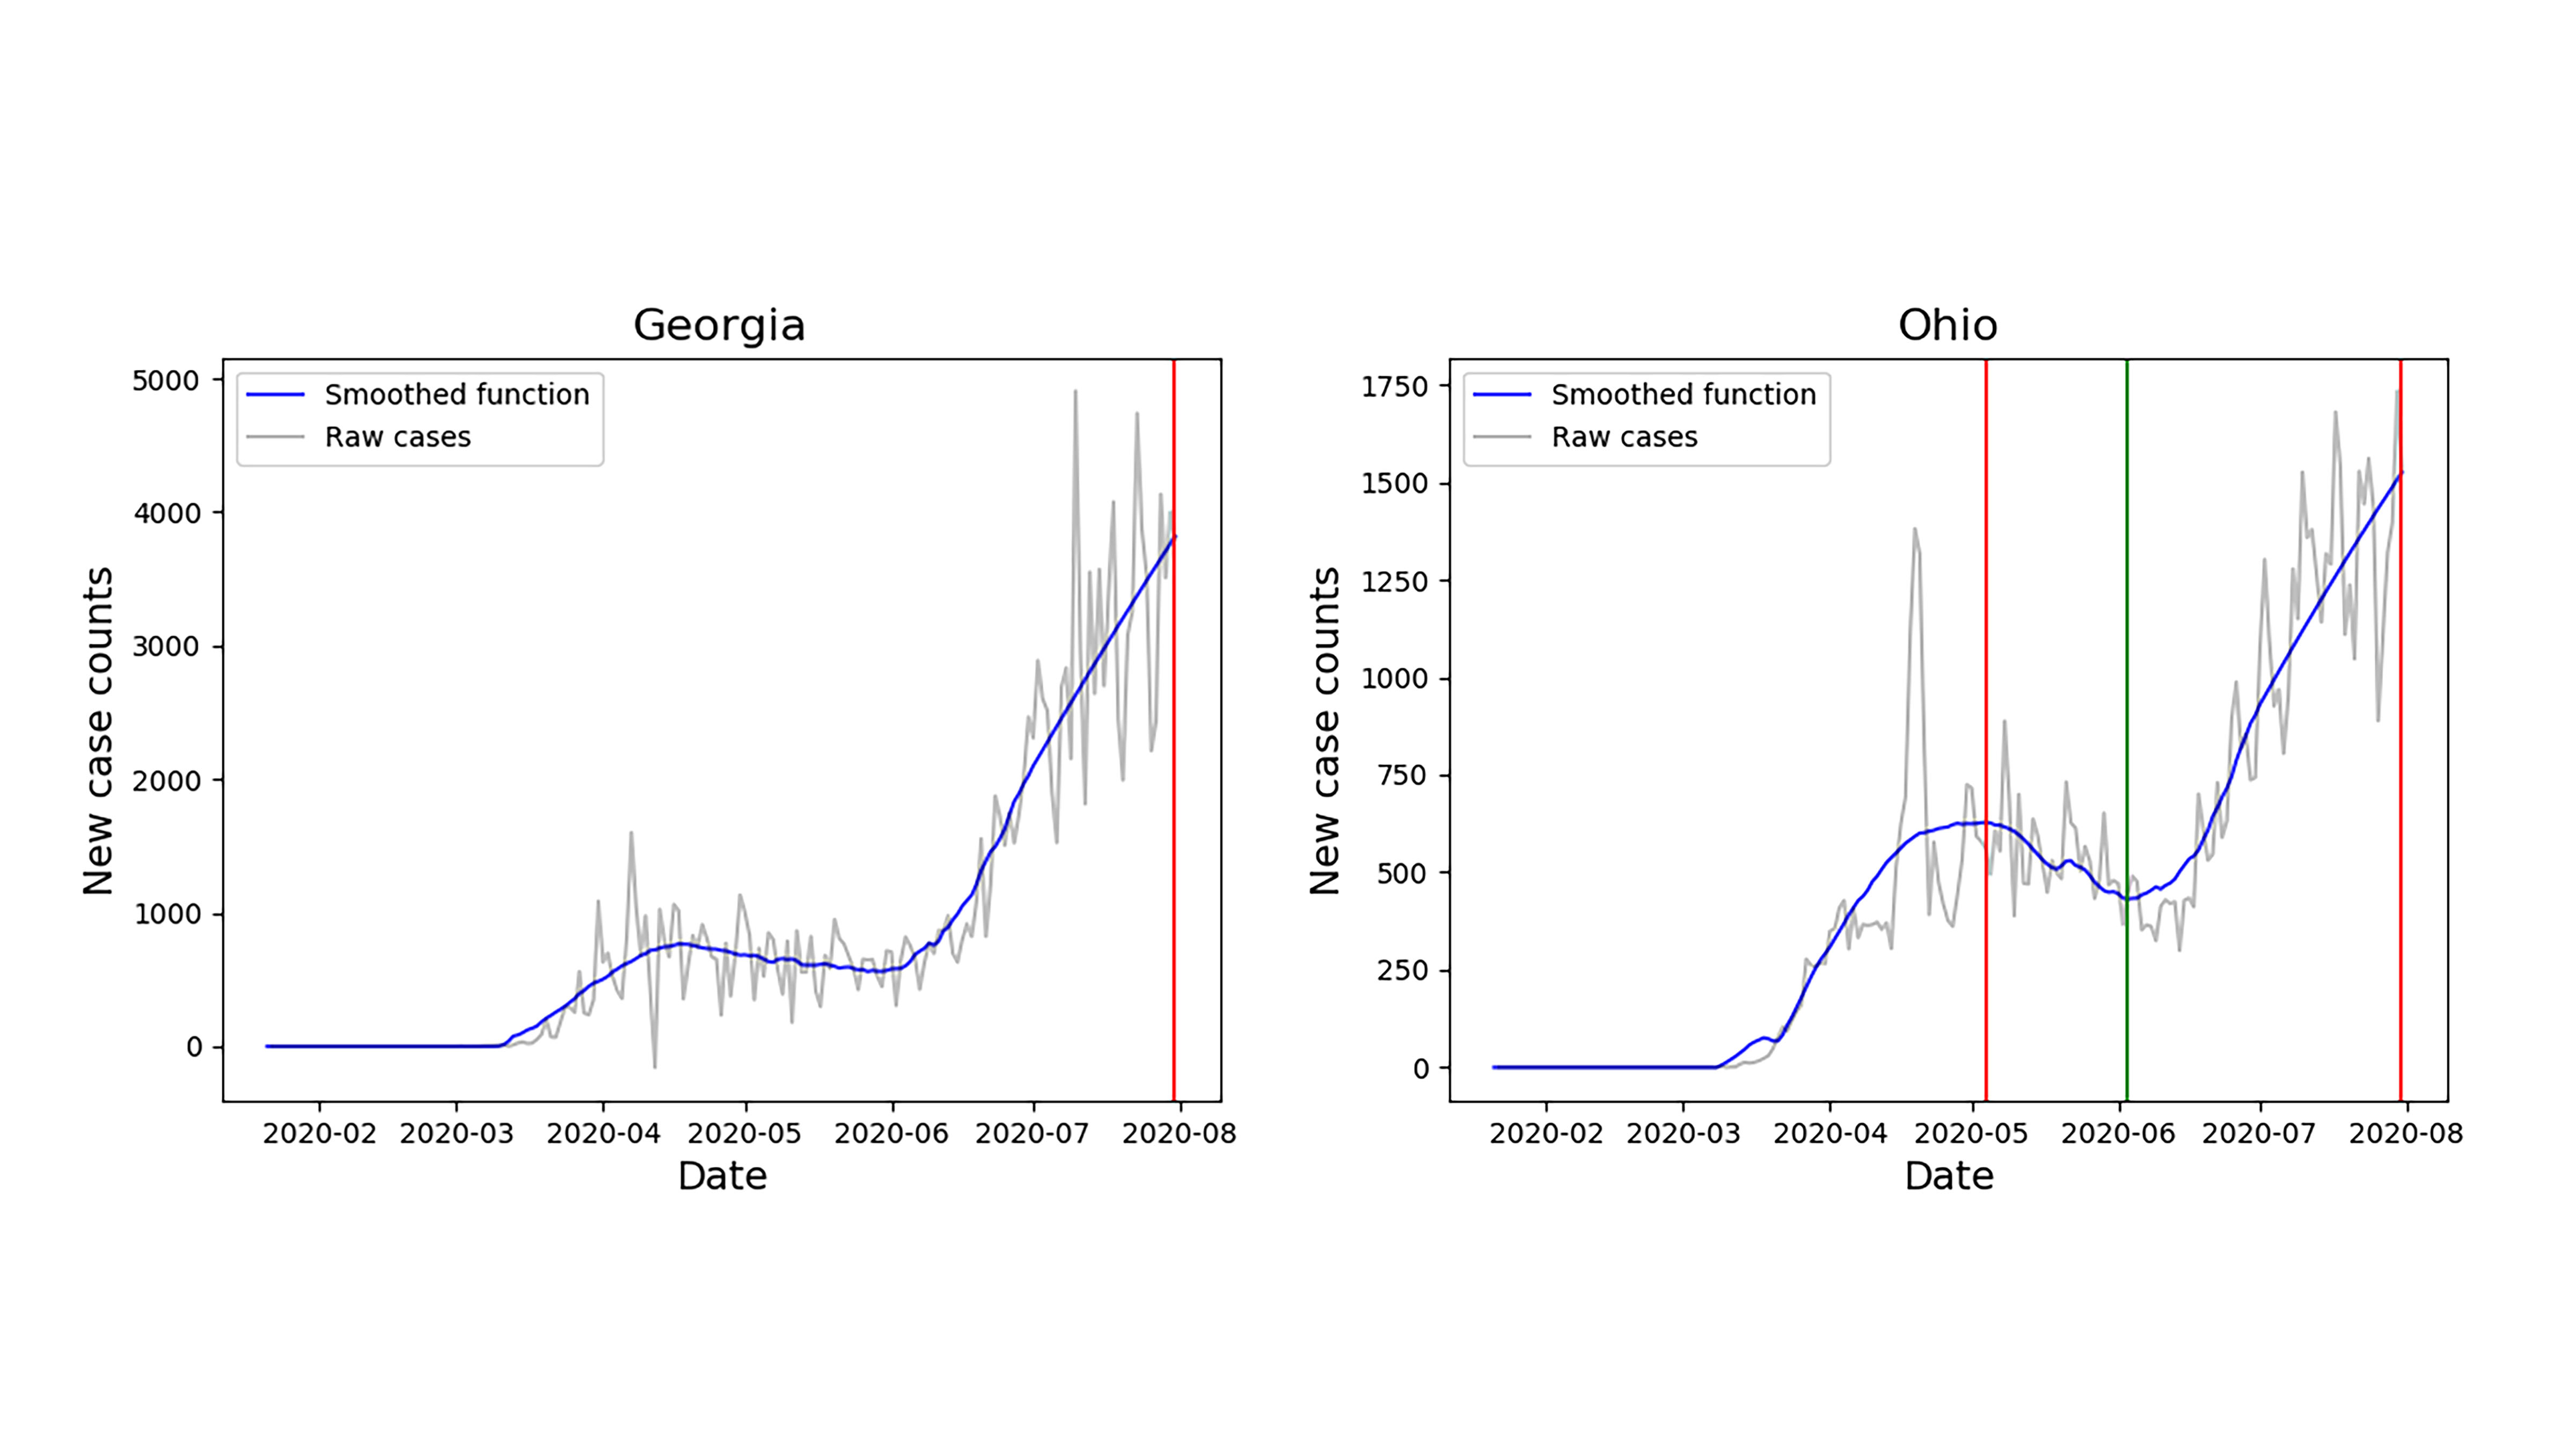
As the COVID-19 pandemic continues, some locations have experienced decreasing numbers of cases followed by an increase. In the journal Chaos, mathematicians report a method to analyze these numbers for evidence of a first or second wave. The authors studied data from all 50 U.S. states plus D.C. for the seven-month period from Jan. 21 to July 31. They found 31 states and D.C. were experiencing a second wave as of the end of July.