Edgeworks, a new research and service facility launched by the Johnny Carson Center for Emerging Media Arts at the University of Nebraska–Lincoln, is helping scientists, inventors and entrepreneurs transform cutting-edge concepts into game-changing reality.
Tag: Data Visualization
Department of Energy User Facility Launches Platform for Analyzing Biological and Environmental Research Data
The Department of Energy’s Environmental Molecular Sciences Laboratory (EMSL) has launched the Data Transformations Integrated Research Platform to help researchers transform their scientific data into more manageable sets of information, improve data accessibility and reproducibility, and facilitate the creation of models and visualization tools that help tell a larger story from the data.
Introducing the Climate Solutions Explorer
IIASA recently launched the Climate Solutions Explorer – a comprehensive resource that visualizes and presents vital data about climate mitigation, climate impacts, vulnerabilities, and risks arising from development and climate change.
New IIASA online tool to visualize global migration patterns
IIASA researchers have developed a new tool – the Global Migration Data Explorer – to help address the lack of data on global migration flows and provide a visual method for exploring migration patterns worldwide.
Hank Childs: Then and Now / 2012 Early Career Award Winner
Supported by his Early Career Research Award at the University of Oregon, computer science professor Hank Childs created new approaches to store, load, and visualize large data sets generated by high-performance computers.
Department of Energy Announces $23.9 Million for Research on Next-Generation Data Management and Scientific Data Visualization
The U.S. Department of Energy (DOE) announced $23.9 million in funding for ten projects in advanced scientific data management and visualization.
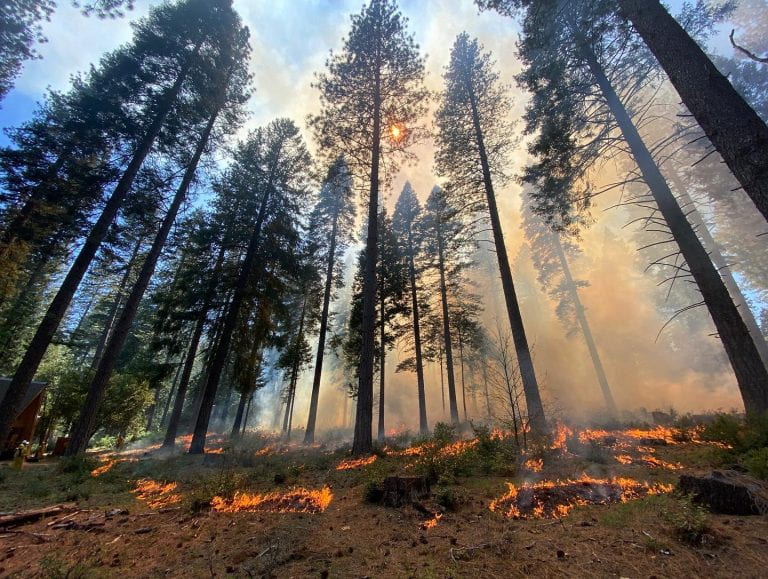
Human-triggered California wildfires more severe than natural blazes
Irvine, Calif., June 6, 2022 – Human-caused wildfires in California are more ferocious than blazes sparked by lightning, a team led by scientists from the University of California, Irvine reported recently in the journal Nature Communications. The research could help scientists better understand fire severity and how likely a blaze is to kill trees and inflict long-term damage on an ecosystem in its path.
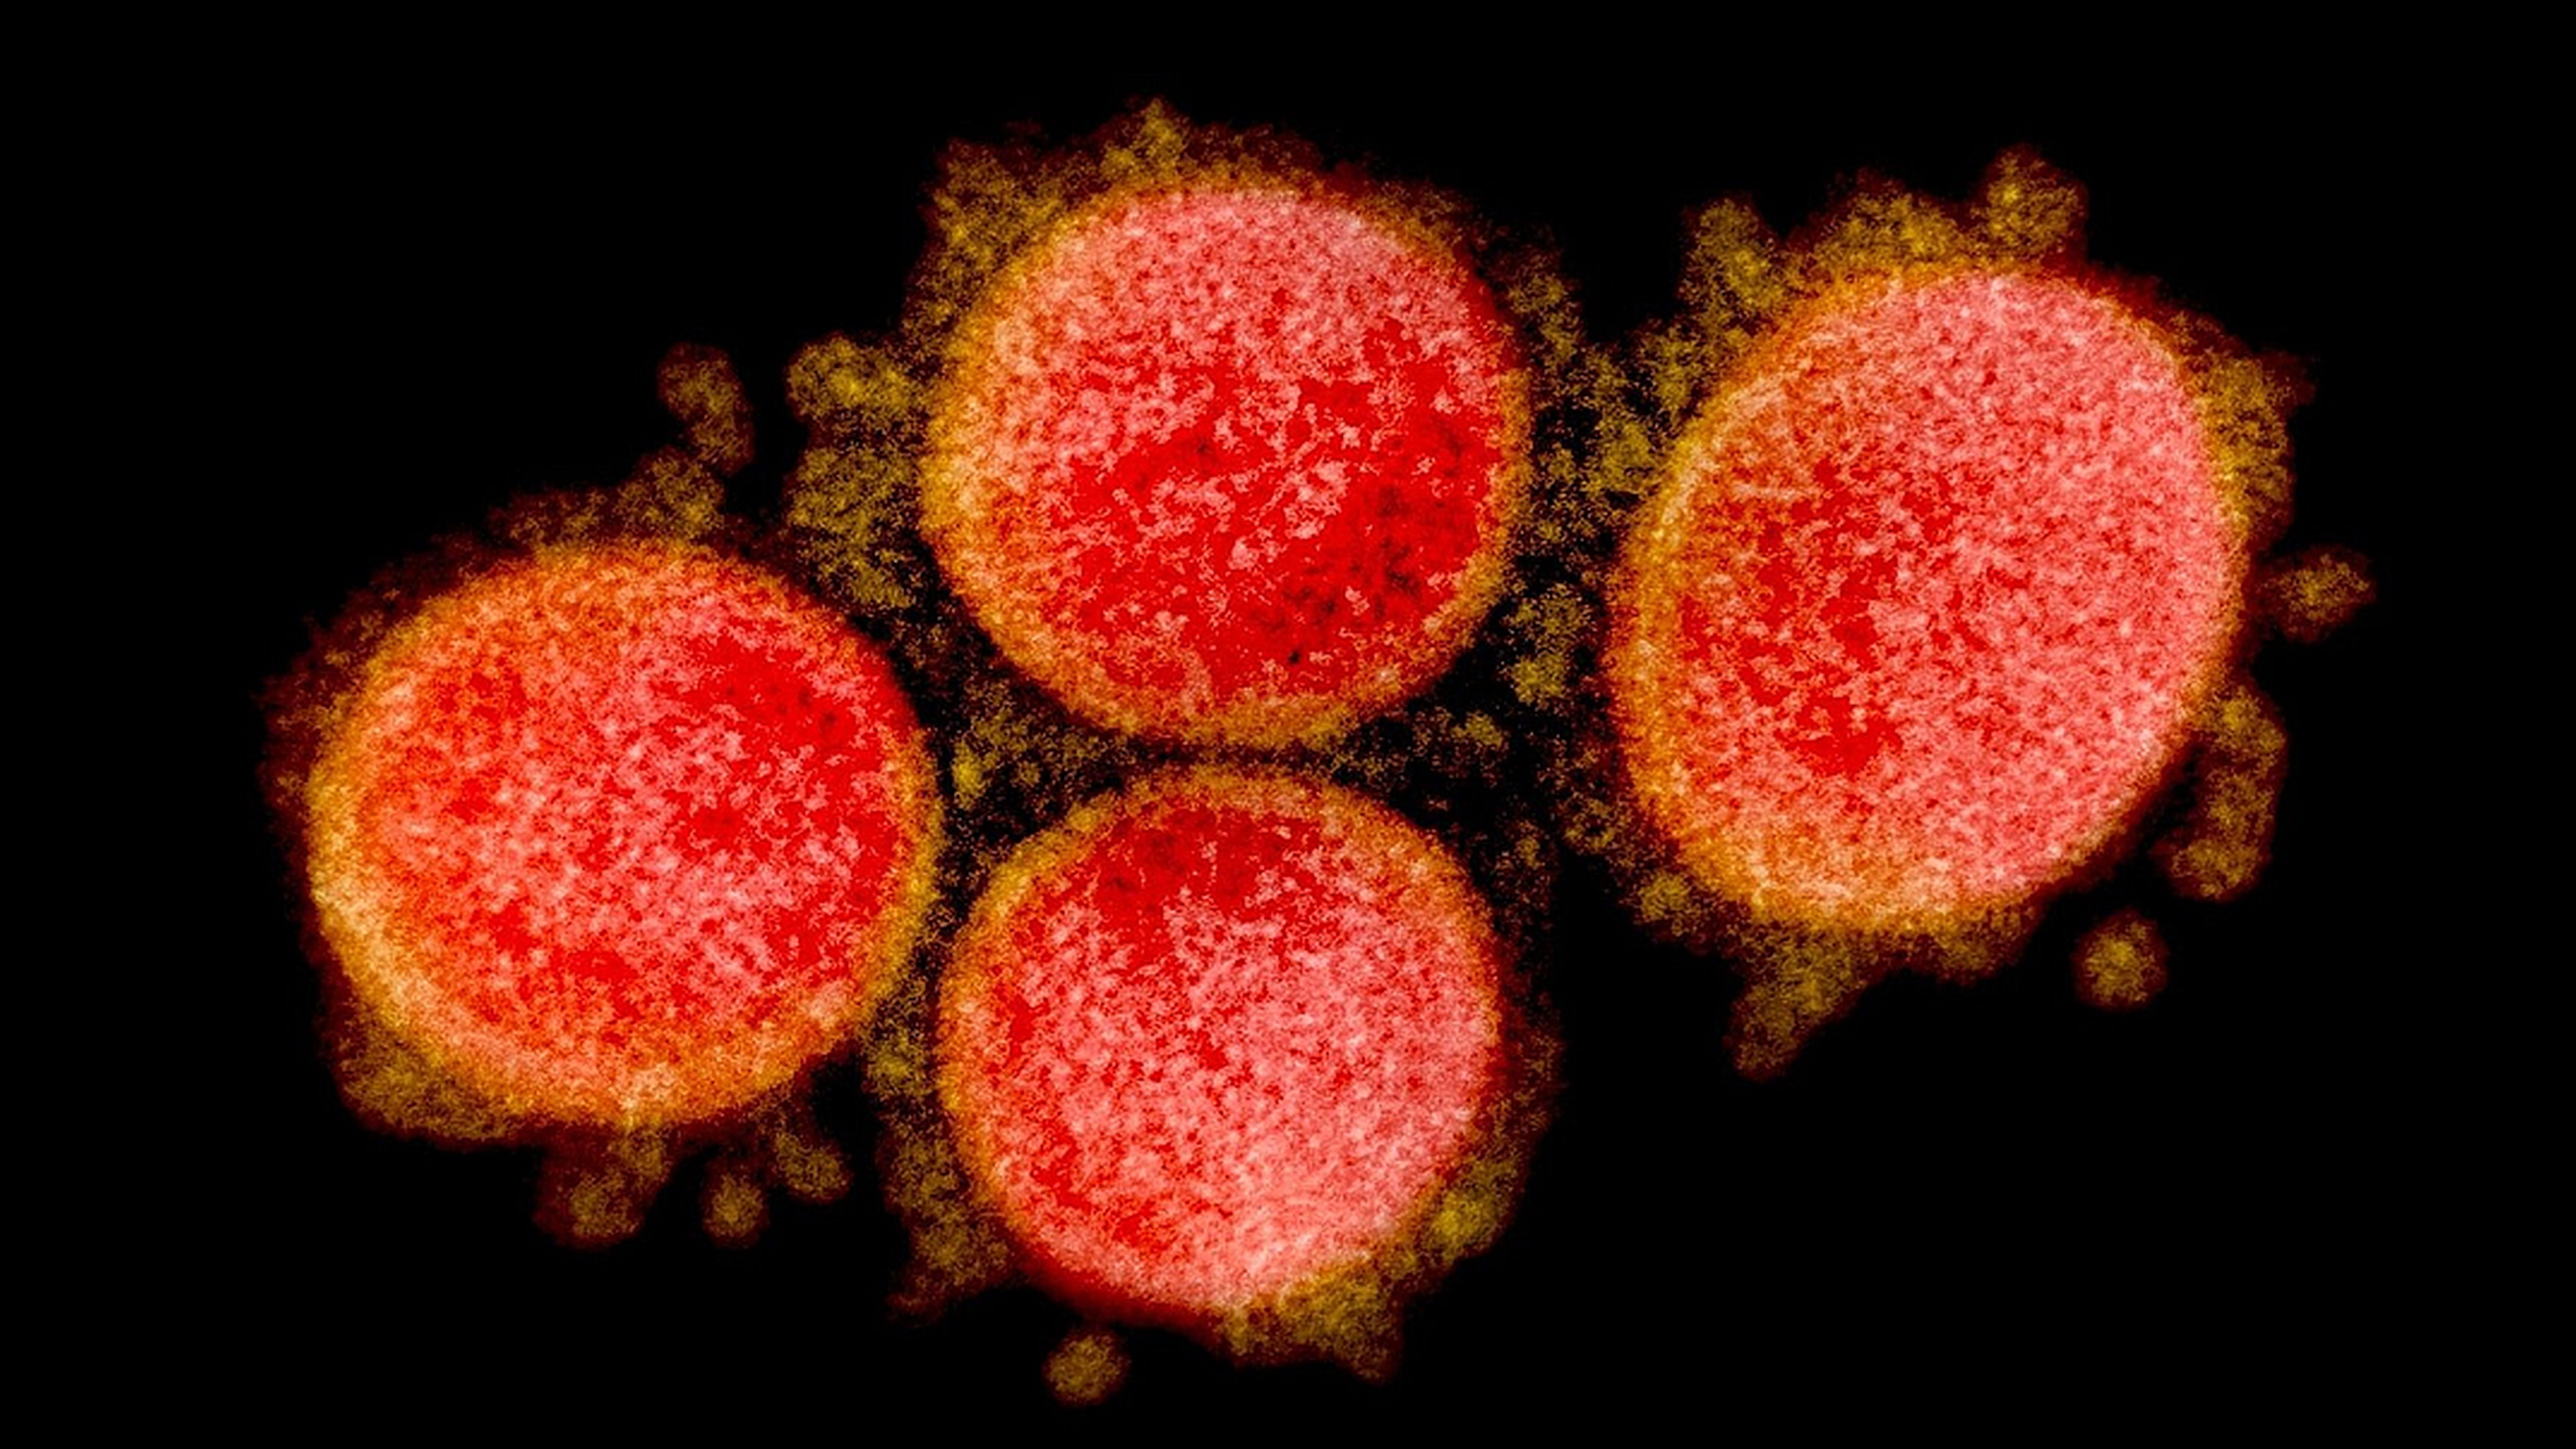
Story Tips from Johns Hopkins Experts on COVID-19
NEWS STORIES IN THIS ISSUE:
PREGNANT AFTER THE FIRST DOSE OF COVID-19 VACCINE — NOW WHAT?
STUDY SHOWS VACCINES MAY PROTECT AGAINST NEW COVID-19 STRAINS … AND MAYBE THE COMMON COLD
EXPANDED DASHBOARD TOOL RANKS ACCESSIBILITY OF STATE VACCINE WEBSITES

WVU responds to data revolution with new major
The world is in the midst of a data revolution. From how we shop to how we vote and all decisions in between, there is a growing need for professionals trained to use modern data analysis to solve everyday problems. To meet these 21st century workforce demands, WVU is launching a new undergraduate data science major.
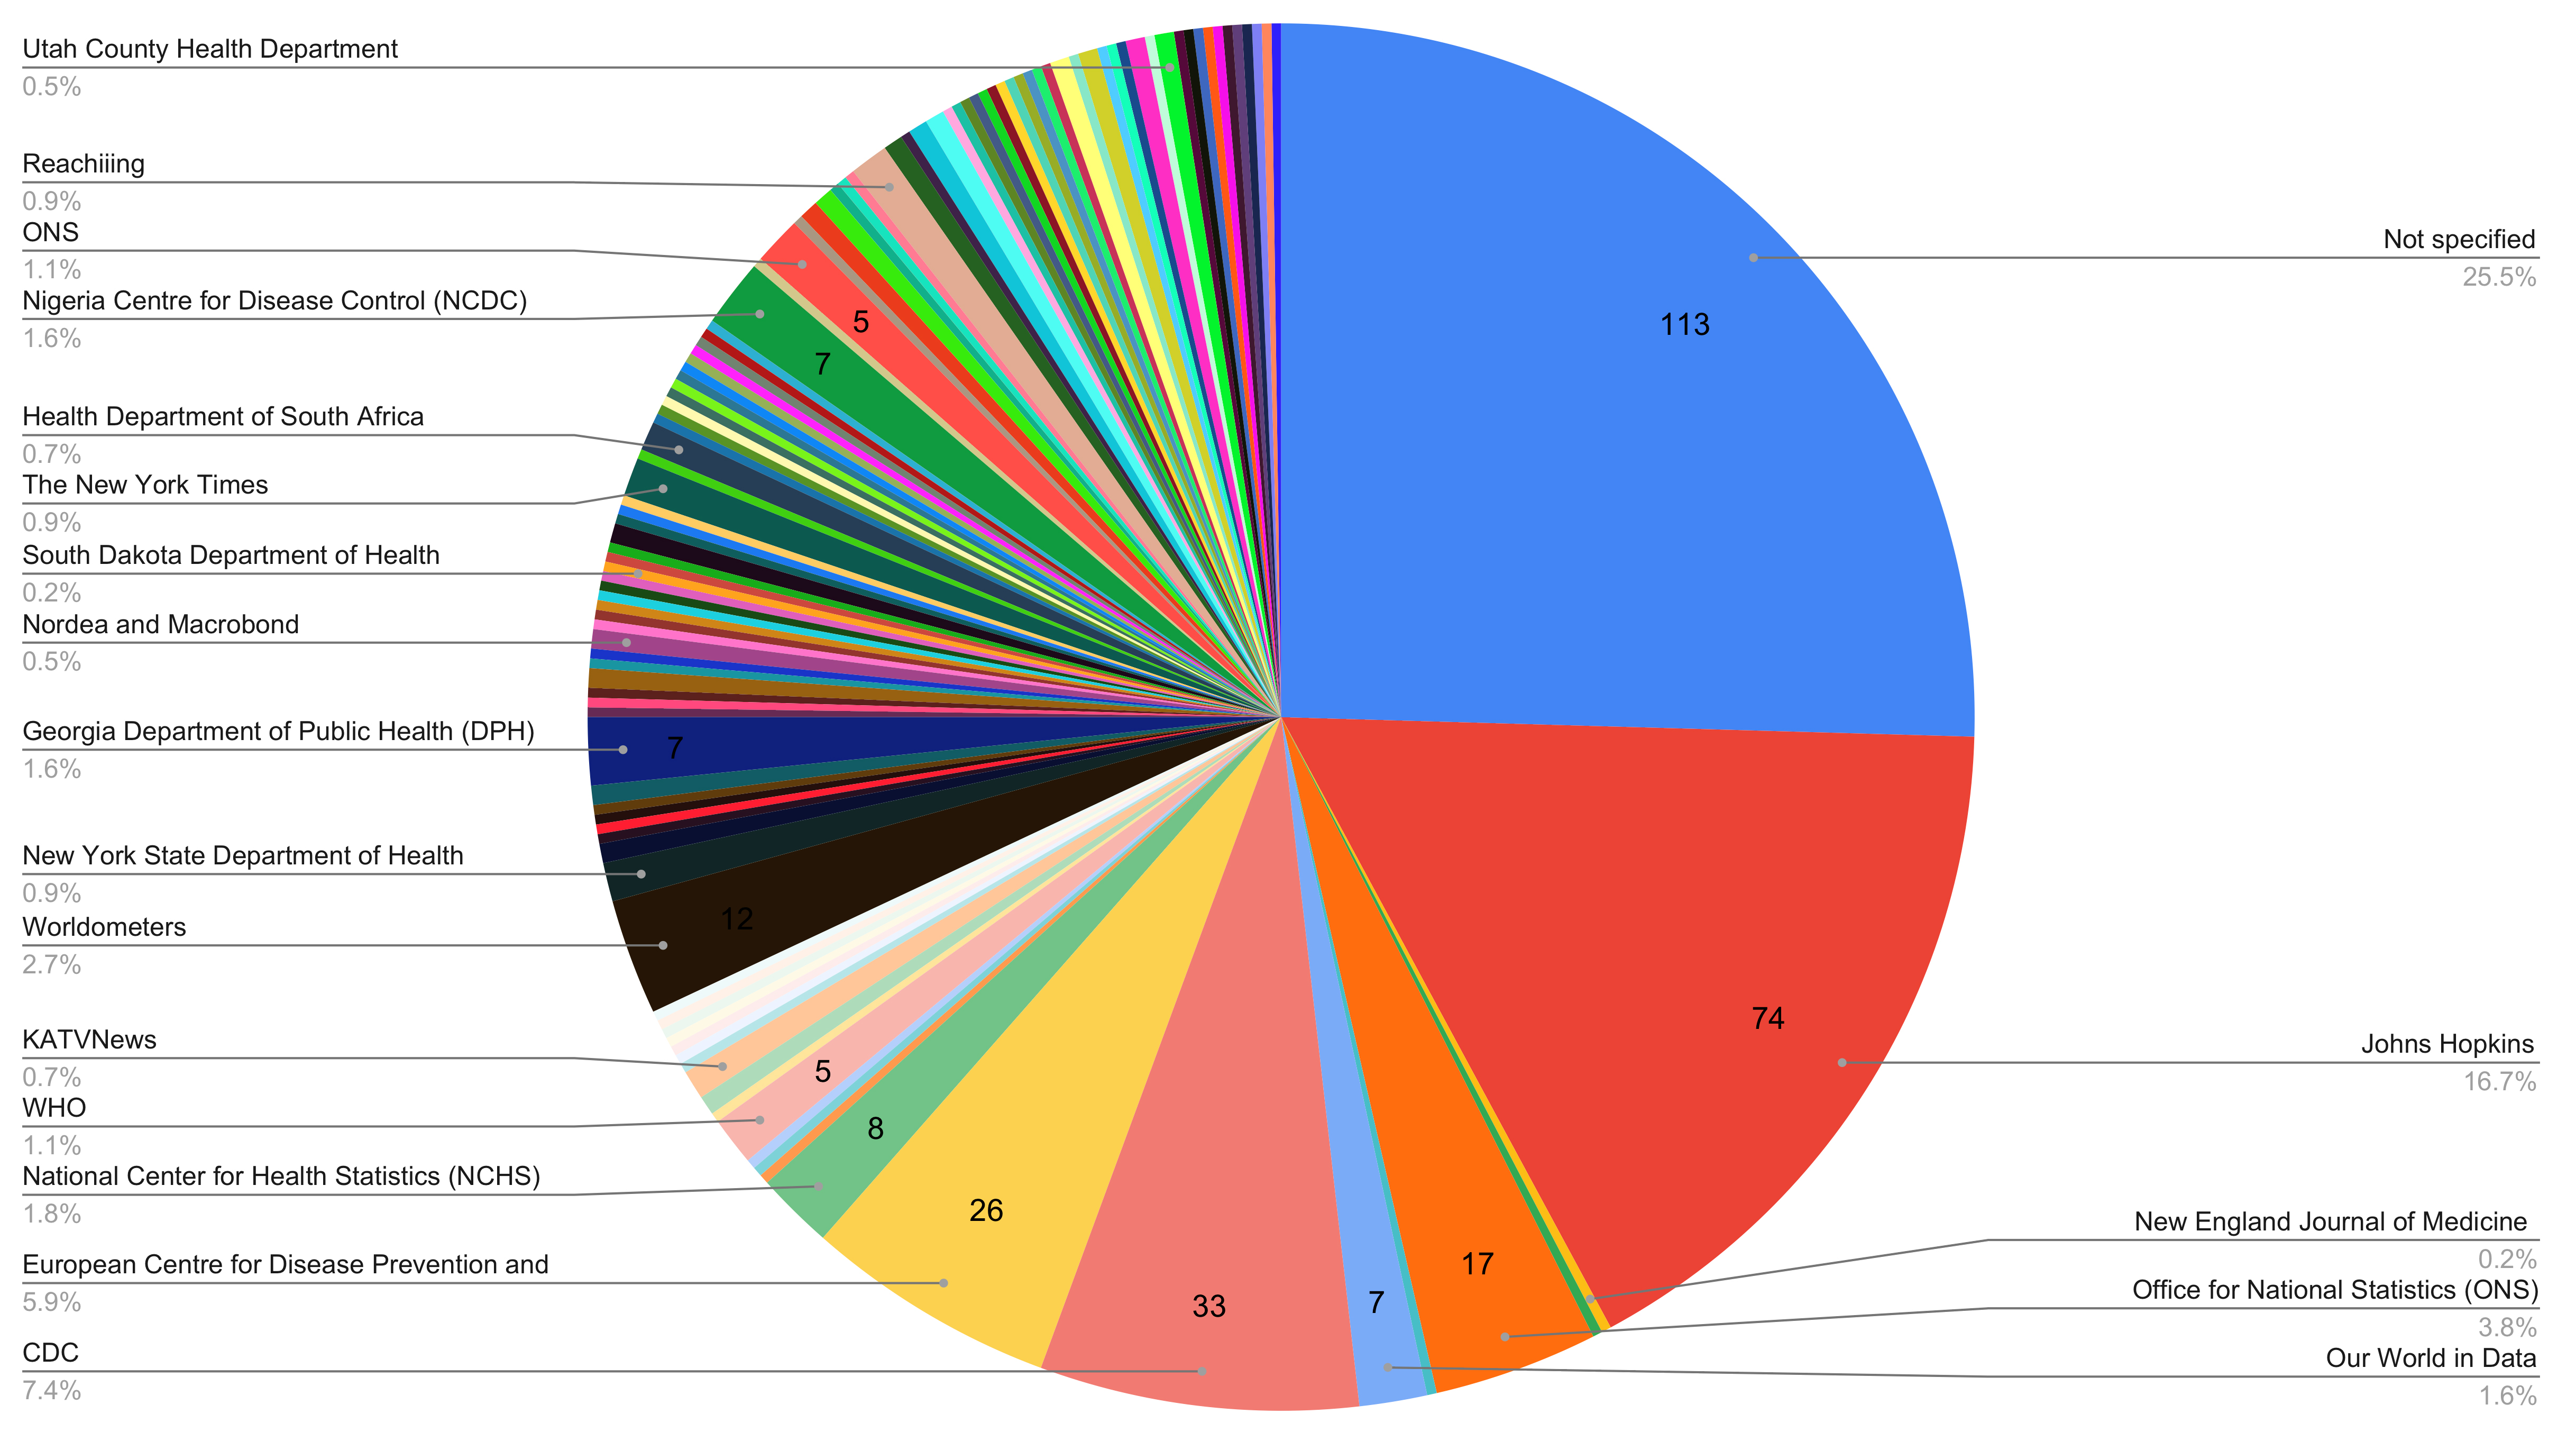
5 mistakes people make when sharing COVID-19 data visualizations on Twitter
An analysis of coronavirus-related information sharing on Twitter from the School of Informatics and Computing at IUPUI found five common errors made by average citizens when trying to visually convey the scope of the COVID-19 pandemic, or its effects on society.
A data visualization platform that tracks countries’ progress on meaningful access to information
The Technology & Social Change Group at the University of Washington Information School has released the Development and Access to Information Dashboards, a data visualization platform that tracks the progress of countries and regions on key indicators related to three dimensions of meaningful access to information: Connectivity, Freedom and Gender Equity.
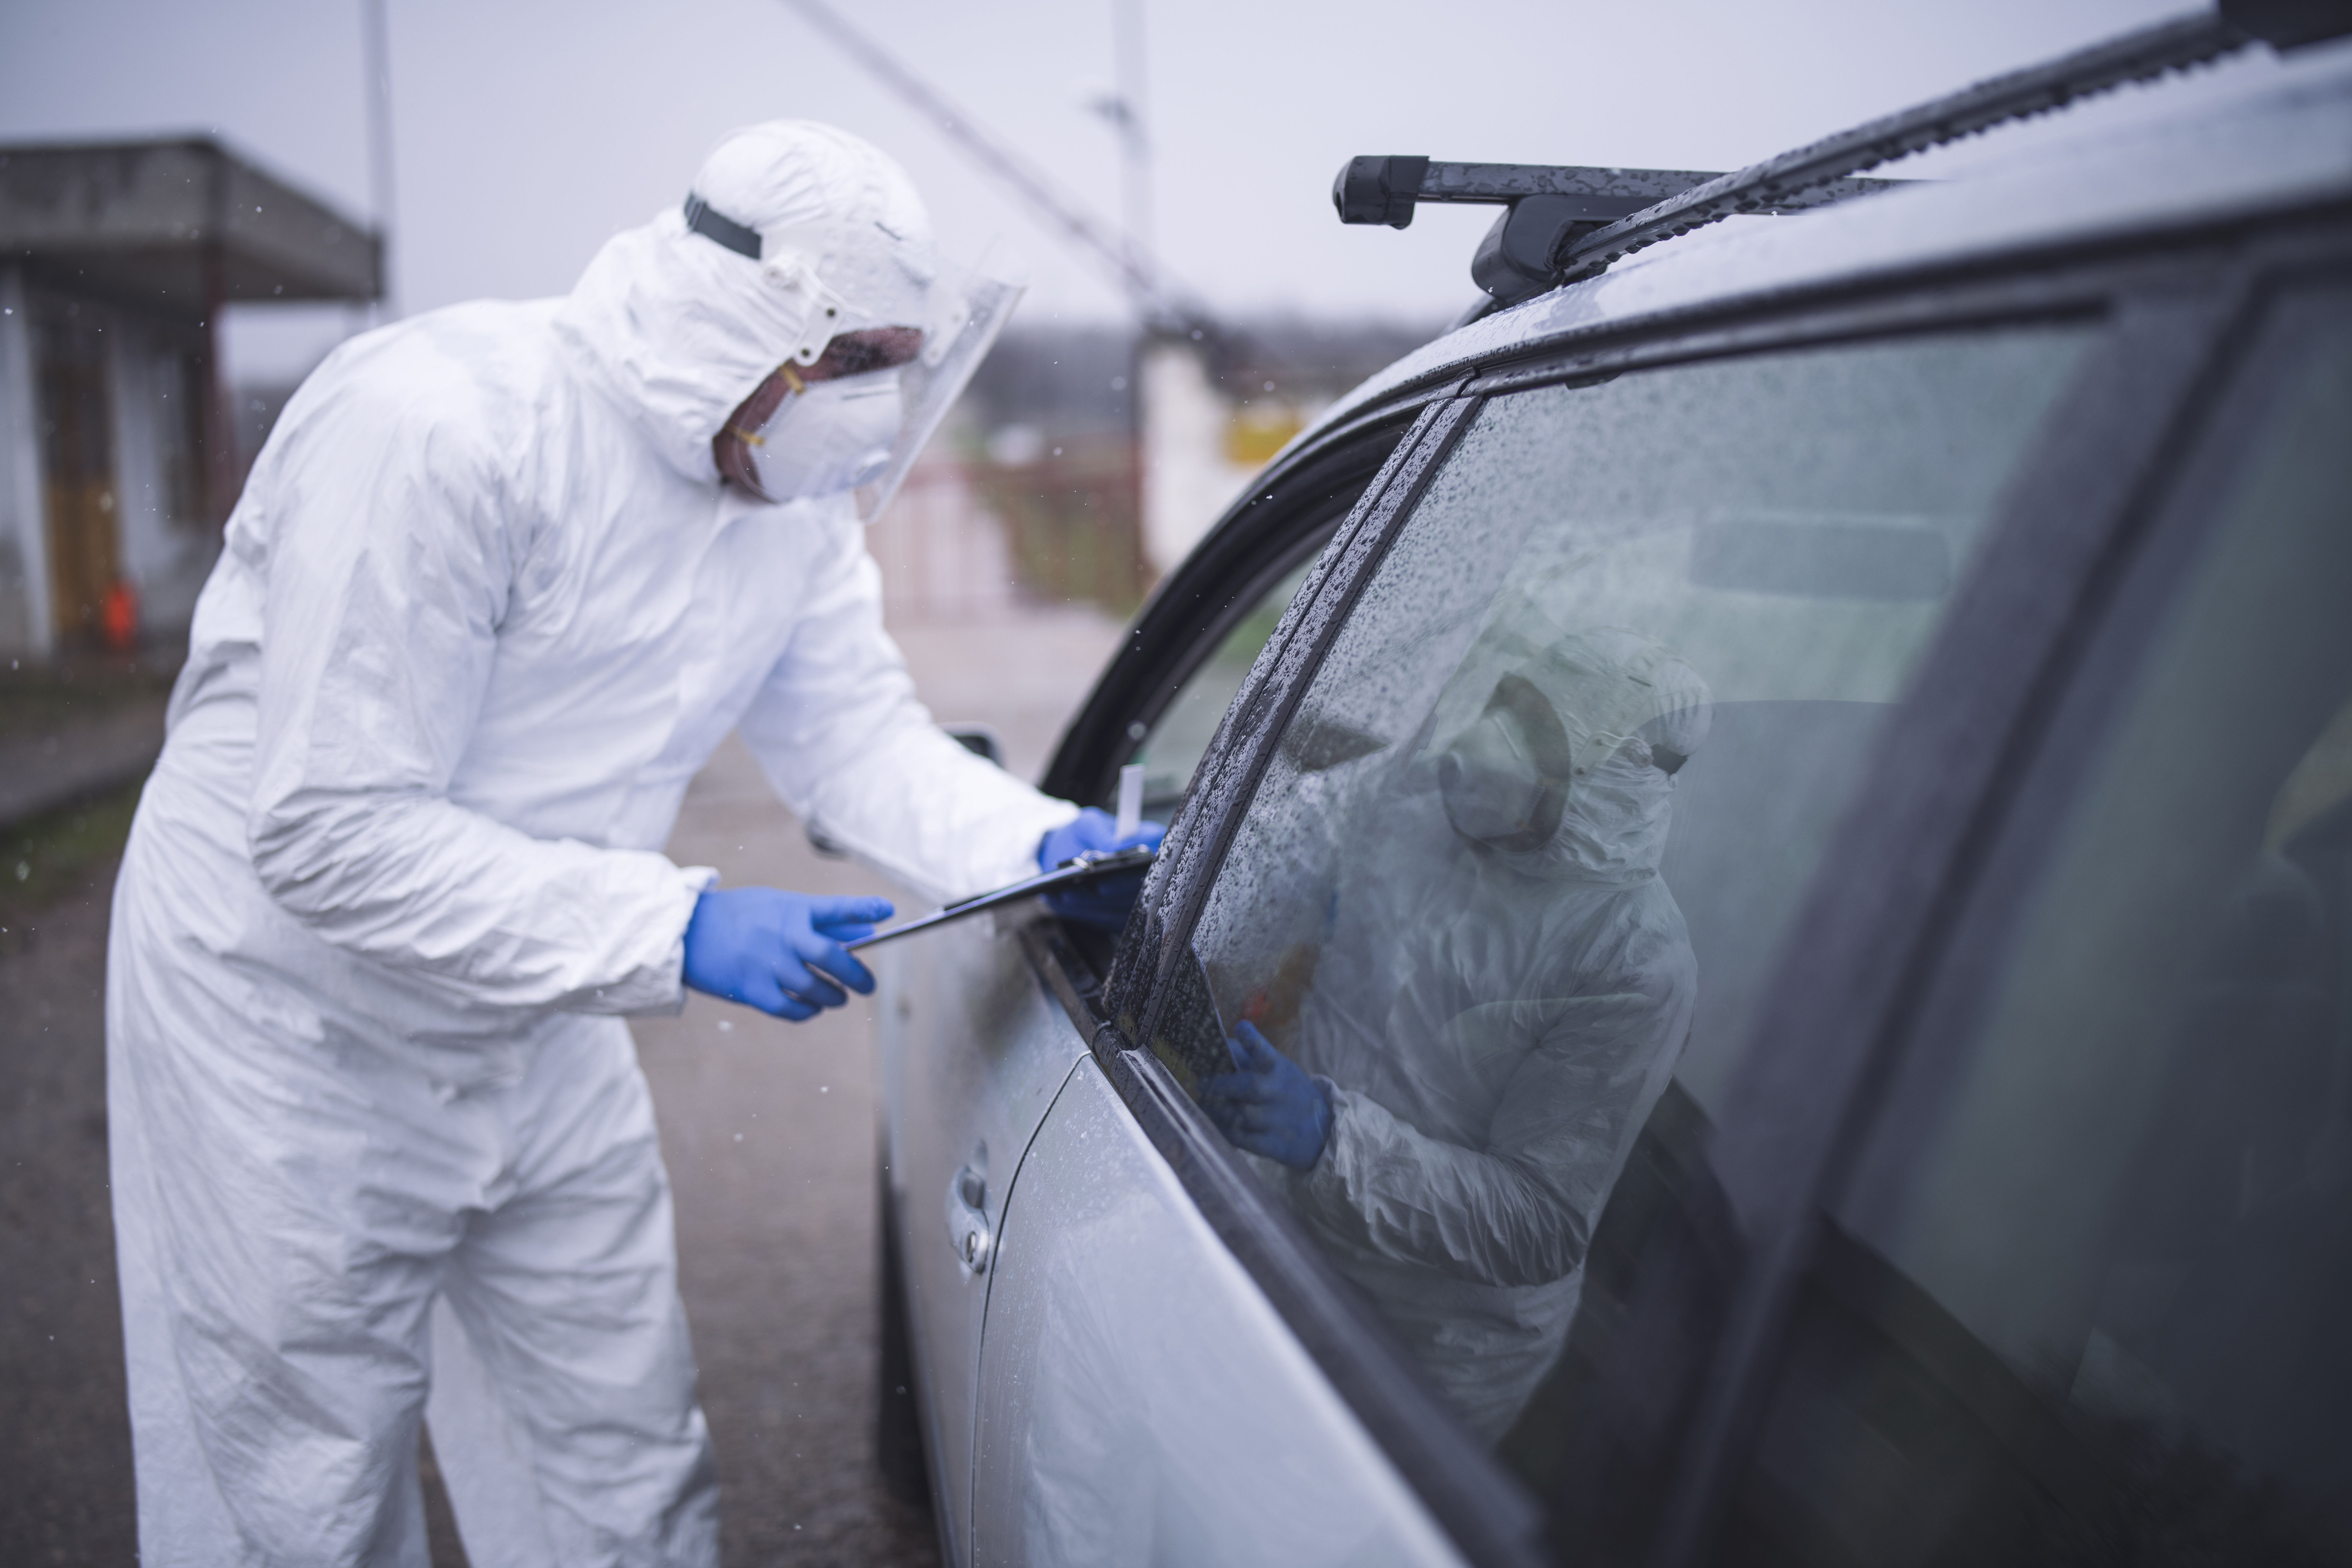
Data Visualization Tool Examines Community Factors Underlying COVID-19 Outcomes
A new data visualization tool examines how and why COVID-19 impacts regions differently. Using daily updated data, COVIDMinder compares community risks, mediation tools, and outcomes related to COVID-19 by state across the United States, and by county within New York state.
Transforming Advanced Nanoscience Data into Interactive Art
A scientist, an artist, and a computer music professor combined 3-D printing, sound, and virtual reality to represent nanoscience data.