Global Temperature Report: November 2020
Global climate trend since Dec. 1 1978: +0.14 °C (+0.25 °F) per decade
November Temperatures (preliminary)
Global composite temp.: +0.53 °C (+0.95 °F) above seasonal average
Northern Hemisphere: +0.67 °C (+1.20 °F) above seasonal average
Southern Hemisphere: +0.39 °C (+0.70 °F) above seasonal average
Tropics: +0.29 °C (+0.52 °F) above seasonal average
October Temperatures (final)
Global composite temp.: +0.54 °C (+0.97 °F) above seasonal average
Northern Hemisphere: +0.71 °C (+1.28 °F) above seasonal average
Southern Hemisphere: +0.37 °C (+0.67 °F) above seasonal average
Tropics: +0.37 °C (+0.67 °F) above seasonal average
Notes on data released December 1, 2020 (v6.0) and happy 42nd Anniversary
November’s seasonally-adjusted, large-scale temperature averages were very close to those of October. The global average was +0.53 °C (+0.95 °F), second warmest to November 2019. The atmospheric temperature over the Northern Hemisphere outside the tropics continues to remain well-above average, giving the whole Northern Hemisphere its warmest November in the 42 years of record at +0.67 °C (+1.20 °F.) Globally, November was a tiny bit cooler than the warmest value achieved last year (+0.55°C.). It’s worth noting that with November 2020 we have completed 42 years of monitoring that began with December 1979.
As you know, the Earth is experiencing a La Niña event now (colder than normal equatorial Pacific sea temperatures) and this should affect global temperatures in the next several months. See here for the latest analysis from NOAA.
https://www.cpc.ncep.noaa.gov/products/analysis_monitoring/lanina/enso_evolution-status-fcsts-web.pdf
The tropical temperature continues to fall as is usual during La Niña events, being the coolest since September 2018. Recall the estimate made last month that if the cooling continues as seen in the last two similar La Niñas, we would expect the global temperature to drop to an anomaly of about +0.2 °C by February or March. If there were no background warming trend, the La Niña global anomalies would almost certainly fall below the zero value, but with an underlying trend of +0.14 °C/decade, the chances of this are small but not impossible.
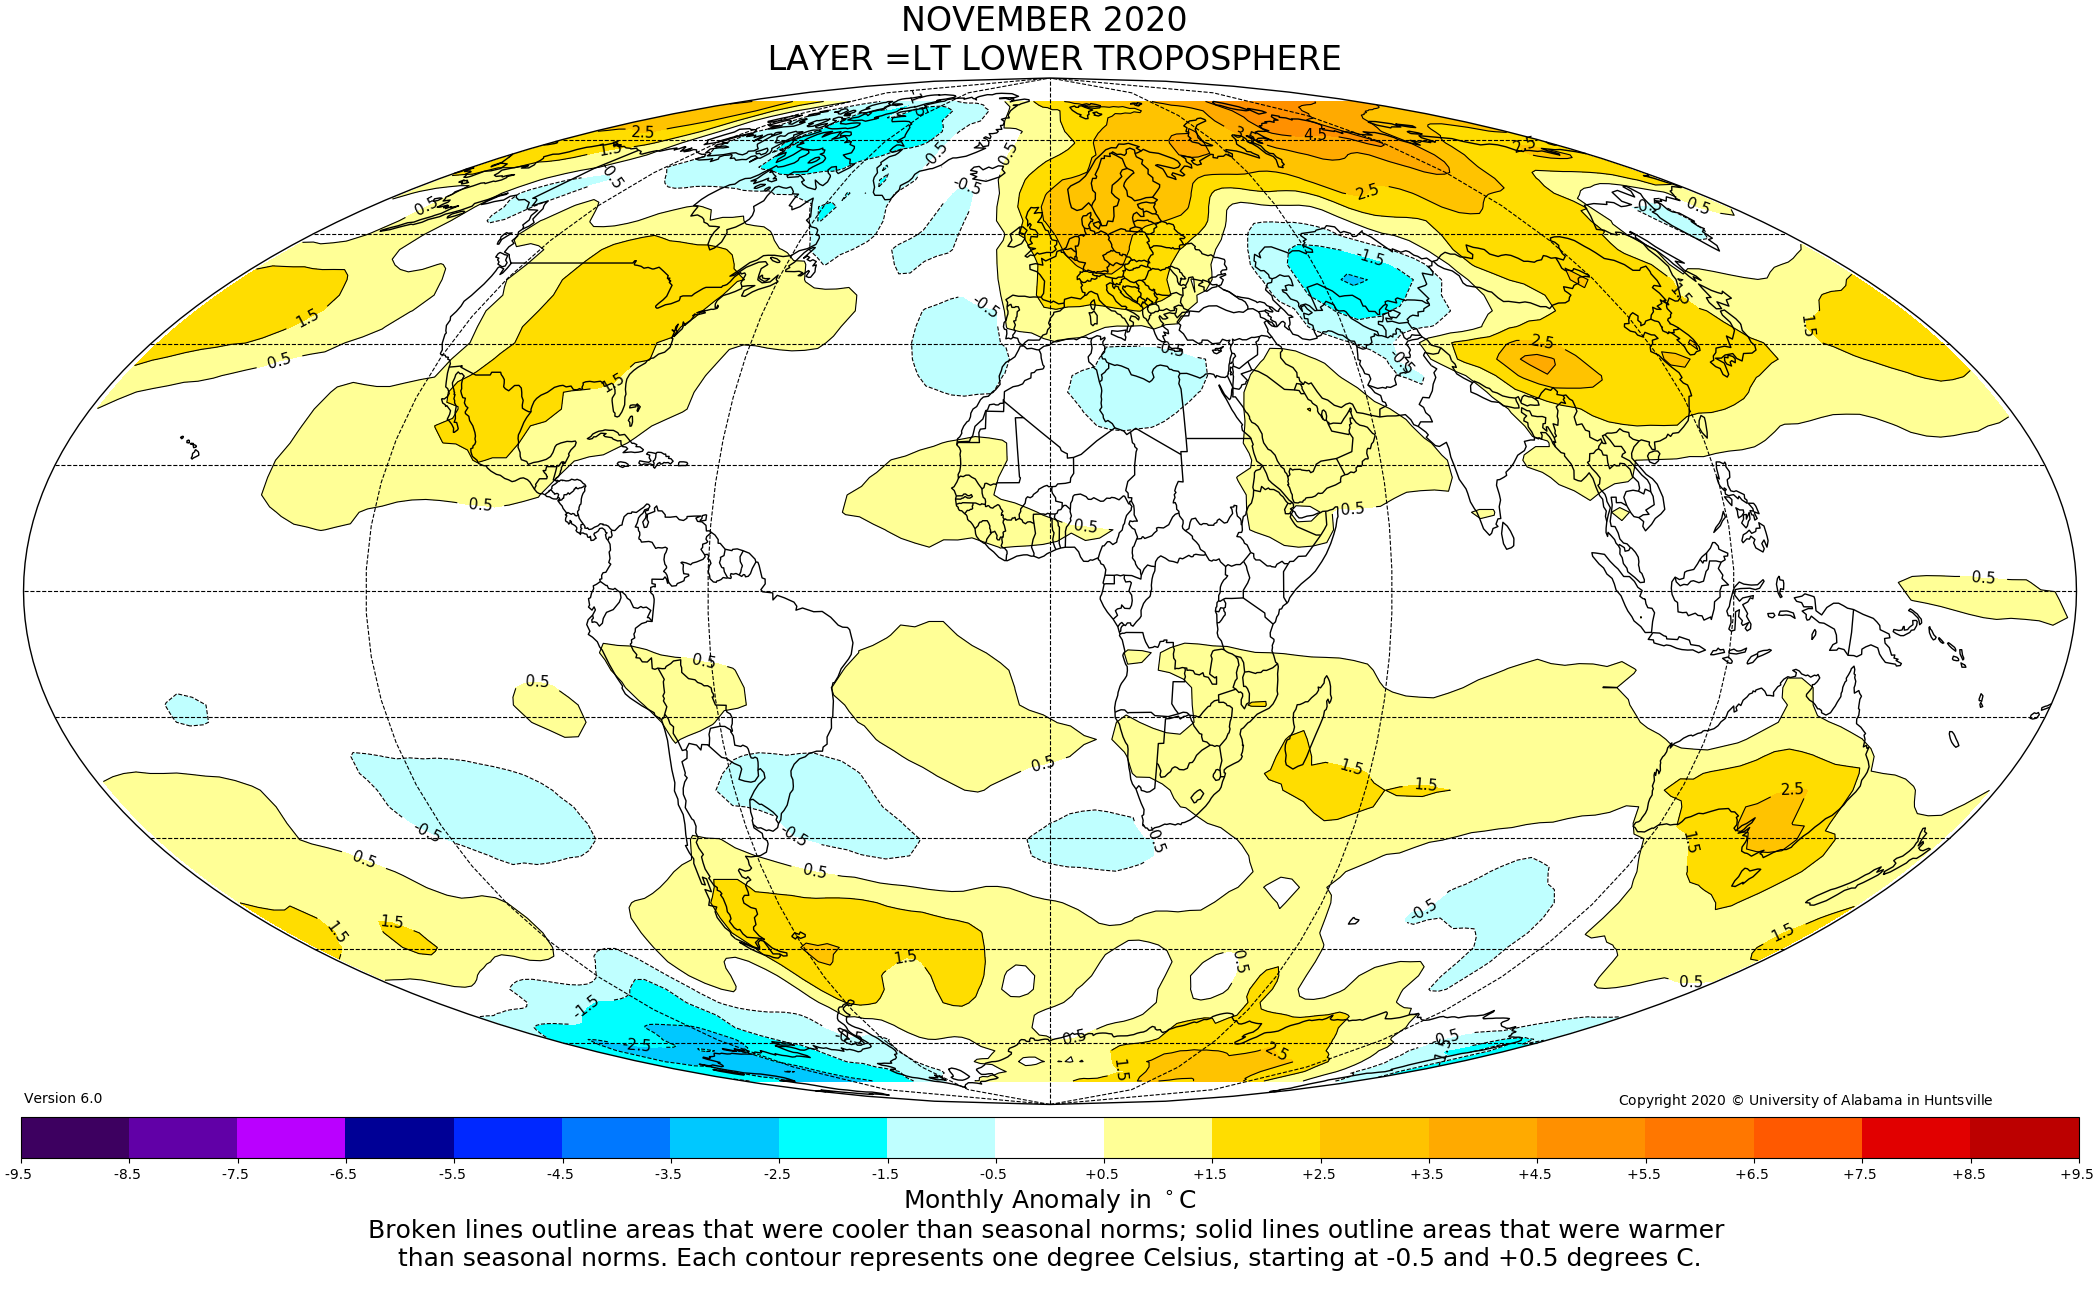
There were a number of regions with warmer than average temperatures this month. The warmest of +5.3 °C (9.6 °F) was over the Arctic Ocean near Komsomolets Island in Russia, with warmth extending from there southwestward to northern Europe and southeastward all the way through China and Japan. The Eastern US, Mexico, Australia, the South Atlantic and East Antarctica were also warmer than average.
Cooler-than-average regions were less extensive, with the coldest spot near Marie Byrd Land in West Antarctica with a reading of -3.5 °C (-6.4 °F). In addition to West Antarctica, other much cooler than average regions were found over Tibet and Baffin Island to Greenland.
The conterminous U.S. experienced an above-average temperature of +1.57 °C (+2.83°F) with the eastern two thirds much above average. Alaska was not quite as warm so that the 49-state mean temperature departure was a little lower than that of the conterminous area being +1.44 °C (+2.59 °F). [We don’t include Hawaii in the US results because its land area is less than that of a satellite grid square, so it would have virtually no impact on the overall national results.]
Considering the 3-month meteorological season of NH Fall and SH Spring, there were values that exceeding all others in the past such 42 seasons. The global average was a very tiny bit warmer in 2020 (+0.547 °C vs. +0.540 °C in 2019) while the NH also exceeded the 2019 measurement with +0.65 °C, being +0.03 °C warmer than 2019. It should be noted that these differences are smaller than the error range of the measurements, so it is better to say that 2019 and 2020 were simply very close. Australia topped out at +0.86 °C in 2020, being warmer than the previous peak of +0.75 °C in Spring of 1998.
Spoiler Alert first published March 2019: As noted over the past several months in this report, the drifting of satellites NOAA-18 and NOAA-19, whose temperature errors were somewhat compensating each other, will be addressed in this updated version of data released from March 2019 onward. As we normally do in these situations we have decided to terminate ingestion of NOAA-18 observations as of 1 Jan 2017 because the corrections for its significant drift were no longer applicable. We have also applied the drift corrections for NOAA-19 now that it has started to drift far enough from its previous rather stable orbit. These actions will eliminate extra warming from NOAA-18 and extra cooling from NOAA-19. The net effect is to introduce slight changes from 2009 forward (when NOAA-19 began) with the largest impact on annual, global anomalies in 2017 of 0.02 °C. The 2018 global anomaly changed by only 0.003°C, from +0.228°C to +0.225°C. These changes reduce the global trend by -0.0007 °C/decade (i.e. 7 ten-thousandths of a degree) and therefore does not affect the conclusions one might draw from the dataset. The v6.0 methodology is unchanged as we normally stop ingesting satellites as they age and apply the v6.0 diurnal corrections as they drift.
To-Do List: There has been a delay in our ability to utilize and merge the new generation of microwave sensors (ATMS) on the NPP and JPSS satellites. As of now, the calibration equations applied by the agency have changed at least twice, so that the data stream contains inhomogeneities which obviously impact the type of measurements we seek. We are hoping this is resolved soon with a dataset that is built with a single, consistent set of calibration equations. In addition, the current non-drifting satellite operated by the Europeans, MetOP-B, has not yet been adjusted or “neutralized” for its seasonal peculiarities related to its unique equatorial crossing time (0930). While these MetOP-B peculiarities do not affect the long-term global trend, they do introduce error within a particular year in specific locations over land.
As part of an ongoing joint project between UAH, NOAA and NASA, Christy and Dr. Roy Spencer, an ESSC principal scientist, use data gathered by advanced microwave sounding units on NOAA, NASA and European satellites to produce temperature readings for almost all regions of the Earth. This includes remote desert, ocean and rain forest areas where reliable climate data are not otherwise available. Research Associate Rob Junod assists in the preparation of these reports.
The satellite-based instruments measure the temperature of the atmosphere from the surface up to an altitude of about eight kilometers above sea level. Once the monthly temperature data are collected and processed, they are placed in a “public” computer file for immediate access by atmospheric scientists in the U.S. and abroad.
The complete version 6 lower troposphere dataset is available here:
http://www.nsstc.uah.edu/data/msu/v6.0/tlt/uahncdc_lt_6.0.txt
Archived color maps of local temperature anomalies are available on-line at:
http://nsstc.uah.edu/climate/
Neither Christy nor Spencer receives any research support or funding from oil, coal or industrial companies or organizations, or from any private or special interest groups. All of their climate research funding comes from federal and state grants or contracts.